Free Job Training for Qualifying Businesses
Free Job Training for Qualifying Businesses
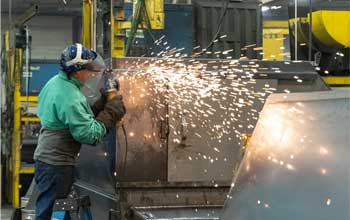
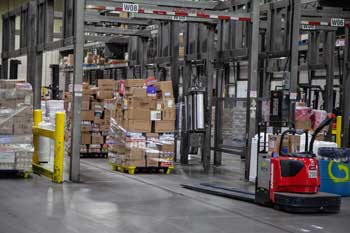
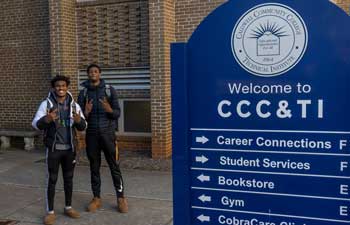
CCED works closely with CCC&TI and local manufacturers to meet the workforce needs of employers.