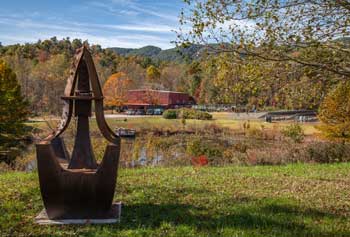
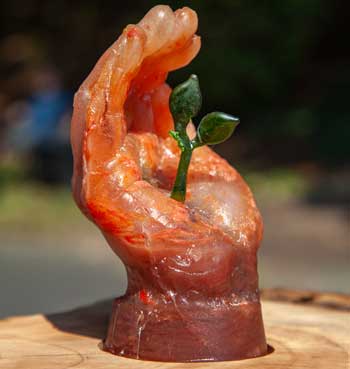
Smithsonian Celebrated Sculpture Gardens
Smithsonian Celebrated Sculpture Gardens
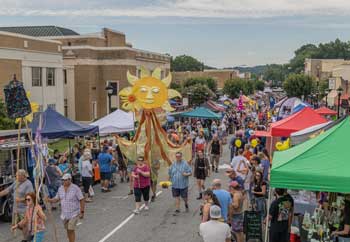
Caldwell County has the most extensive collection of permanent public outdoor sculptures per capita in the U.S. Our annual Sculpture Celebration is the largest in the South.